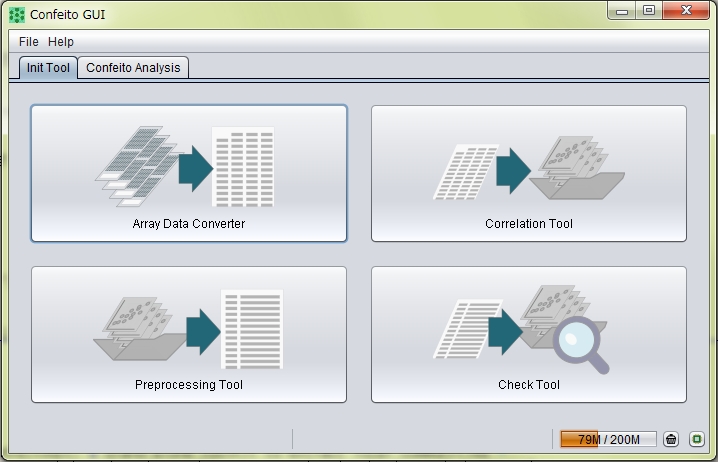
confeito

ConfeitoGUI

a tool for correlation network analysis
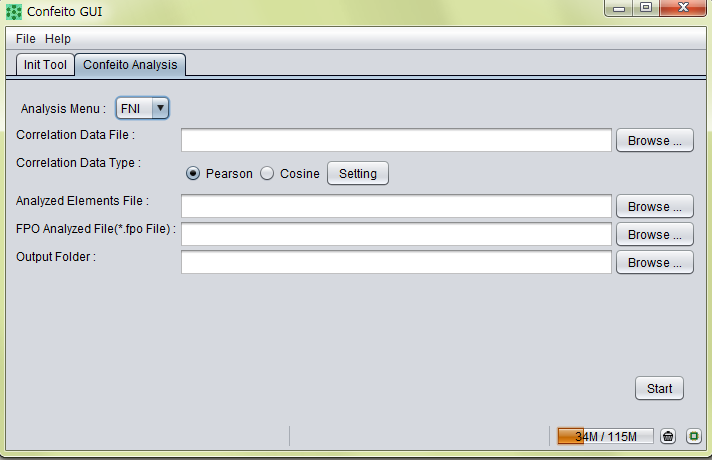
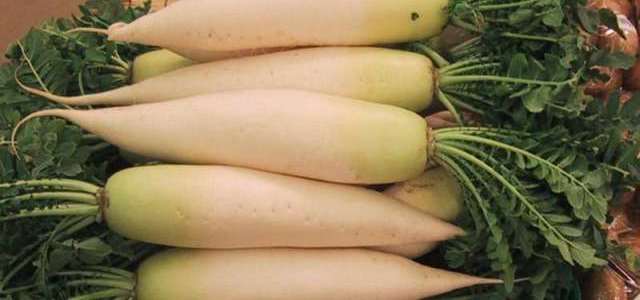
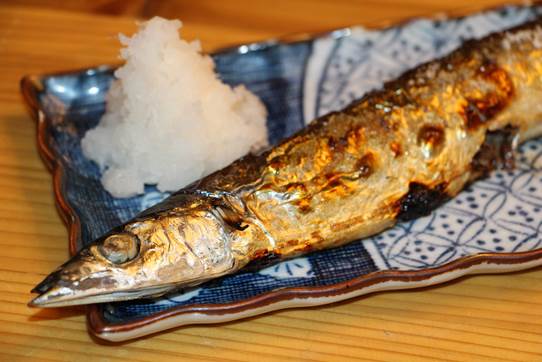
Example 3

★ Dataset


★ Purpose of Example 3


★ Methods

  • Making a correlation matrix
    1. Click launch.bat to open ConfeitoGUI.
    2. Click Correlation Tool in the Init Tool tab to open the Correlation Tool window.
    3. In the Input File section, click “Browse” and select a file of the dataset.
    4. In the Task section, select a type of correlation coefficient (select “Cosine”).
    5. In the Output Folder section, select an output folder (make and select “cor”).
    6. Push the Start button to execute the calculation.
    init tool correlation tool
  • Preprocessing for network analysis
    1. Click Preprocessing Tool to open the Preprocessing Tool window.
    2. In the Correlation Data Folder section, browse and select “cor”.
    3. In the Output File section, browse this folder and name “rsacor.flis”, and then push the select button.
    4. Push the Start button to make the file “rsacor.flis”.
    5. Push “x” at the topright corner of the Preprocessing Tool window to close the window.
    6. Click the Check Tool button to open the Check Tool window.
    7. In the Correlation Data File section, browse and select “rsacor.flis”.
    8. Click the Start button to execute.
    preprocessing tool check tool
  • The FPO analysis
    1. Click the Confeito Analysis tab and select Analysis Menu (select “FPO” in this example).
    2. In the Correlation Data File section, browse and select “rsacor.flis”.
    3. In the Correlation Data Type section, select Cosine.
    4. In the Output Folder section, make and select an output folder (make and select “fpo”).
    5. Push the Start button to execute.
    confeito analysis
  • Preprocessing for the FNI analysis
    1. Download and expand Perl programs for the preprocessing into a folder.
      (“prefniprocess.pl” and “postfniprocess.pl” are made)
    2. These tools are Perl scripts, and therefore, it is necessary that Perl commands are performable.
    3. For a Windows user, install ActivePerl.
    4. Input “perl -v” on the command prompt to check the performance of Perl commands.
    5. For a Linux user, simply input “perl -v” on the terminal.
    6. Move “prefniprocess.pl” into the “fpo” folder.
    7. Open the Perl script by a text editor.
    8. Input an element ID of interest within double quotations in the 5th line of the script.
    9. Save and close the Perl script.
    10. Doubleclick the file to execute (a list of element identifiers is made).
    11. Instead of using this Perl script, a user can make a list of element IDs in a column in a text file.
  • The FNI analysis
    1. Click the Confeito Analysis tab and select Analysis Menu (select “FNI” in this example).
    2. Correlation Data File: browse and select “rsacor.flis”.
    3. Correlation Data Type: automatically selected by the setting the “Correlation Data Type”.
    4. Analyzed Elements File: select the file made in the previous section.
    5. FPO Analyzed File(*.fpo File): browse and select “result.fpo” in the “fpo” folder.
    6. Push the Start button to execute (“result.net” is made).
    FNI analysis
  • Results
    1. Open the output folder of the FNI analysis (“fni”).
    2. Open the file “result.net” using a software for network analysis (such as Pajek).
    3. Draw a network using the file.
    4. Solid lines represents interconnections between elements detected by the FPO analysis.
    5. Dashed lines represents interconnections from elements detected by the FNI analysis.
    6. In the case of Example 3, network modules including “karami” and “umami” metabolites were obtained.
    7. Karami and umami metabolites decreased and increased with time after grating, respectively.
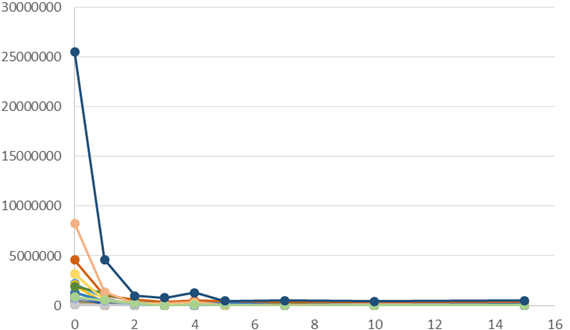
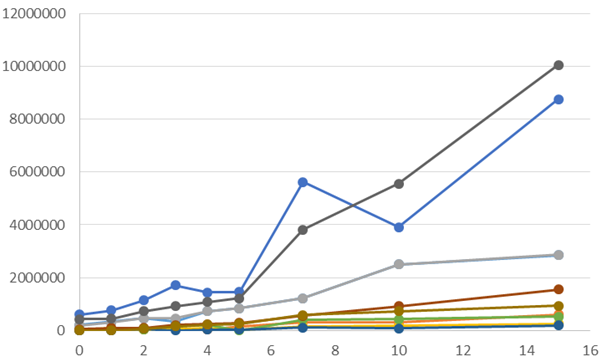
    Results of karami metabolites hot FNI module hot chart
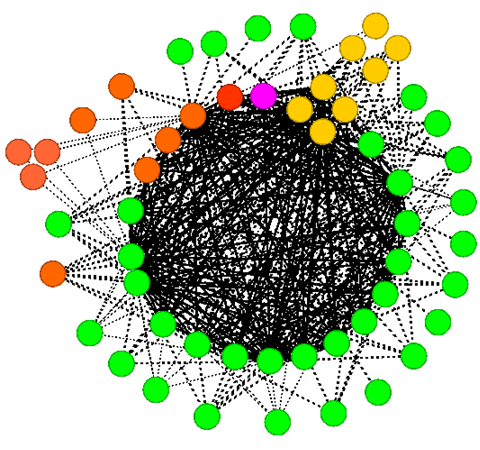
    Results of umami metabolites
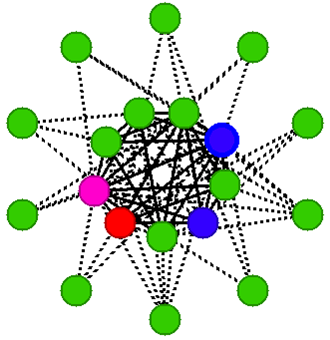
 hot FNI module hot chart

    Back to the portal.


    The KAGIANA Project (since 2006)

    Copyright (C) 2015 All rights reserved Osaka Prefecture University & Kazusa DNA Research Institute