Gcorn classic
Database of gene phylogeny

Help for Gcorn classic

★ Gene search

♦ This search contains only three steps as follows.
  1. Keywords

    • Input a single gene/protein identifier; e.g., “NP_181241.1” for RefSeq & “P35510” for UniProt.
    • Input five or less keywords; e.g., “cold stress”.
  2. Species

    • Select a single species from the pull-down menu.
  3. Submit

    • Just click the “submit” button.
  4. Advanced search

    • When selecting multiple species, this search is available.

★ Candidate page

♦ Gcorn

  • Click the “Gene group” button to show a page for a gene group that contains a gene of interest.
  • Click the “Orthology” button to show a page for orthologous genes to a gene of interest.

♦ RefSeq

  • Click the identifier to jump a page of the RefSeq database for a gene/protein of interest.

♦ Gene product

  • The name of gene product of a gene of interest.

♦ Species

  • Click the species name to jump a page of the Taxonomy database for a species of interest.

♦ UniProt

  • Click the identifiers to jump a page of the UniProt database for a gene/protein of interest.

♦ Identifiers

  • Other identifiers for a gene of interest.

♦ CDD

  • Click the identifiers to jump a page of the Conserved Domain Database (CDD) for a gene/protein of interest.

♦ Gene annotation

  • The description on gene function & expression of a gene of interest.

★ Homology page

♦ Homologous gene group (HGG)

  • A homologous gene group (HGG) represents a group of genes homologous to each other based on their similarity in base or amino acid sequences.
  • Namely, a gene presumed from the group members was hypothetically one contained in an ancient organism.

♦ Gene phylogeny

  • The phylogenetic tree is depicted for a HGG that contains the gene of interest & 20 or less genes.
  • The X axis represents the H.I. index (0.300 to 1.000).
  • Evolutionary time gains from the left to the right; i.e., the right edge represents the present.
  • H.I. represents a F-measure index of the ratio of shared amino acids between a gene pair as the following equation.

  • In the above equation, Na, Nb, & Nc represent the numbers of amino acids contained in Gene A, contained in Gene B, & shared between these genes.
  • The maximal H.I. value (i.e., 1) mean that both sequences are coindident to each other.
  • The smaller H.I. means the more different amino acids between a pair of genes, and thus, the ancestral gene of the pair was hypothetically shared more anciently.

♦ Ancestry lineage

  • This line chart represents numbers of genes, species, & families contained in HGGs that are evolutionally traced back from a gene of interest.
  • The X axis represents the H.I. index, similar to the above phylogenetic tree.
  • Information on the phylogenetic tree is contained in this line chart.
  • At a horizontal point, when the number of genes decreases but species keeps its number, the chart means that there was hypothetically a paralogous event at the point.
  • When the both numbers of genes & species decrease, it means that there was hypothetically an orthologous event at the point.
  • Not only these homologous events, this chart is helpful for understanding gene functionality.
  • This line chart is an epitome of the evolutionary transition of a gene of interest.
  • Click the button below the chart to show numbers of all HGGs.

★ Orthology page

♦ Threshold of H.I.

  • A threshold value of H.I. is availeble for depicting the below figures.
  • In these figures, red, dark red, gray items (nodes & names) represent an organism of interest, organisms that contain genes orthologous to a gene of interest, & those that contain no gene orthologous to the gene.

♦ Species-species network

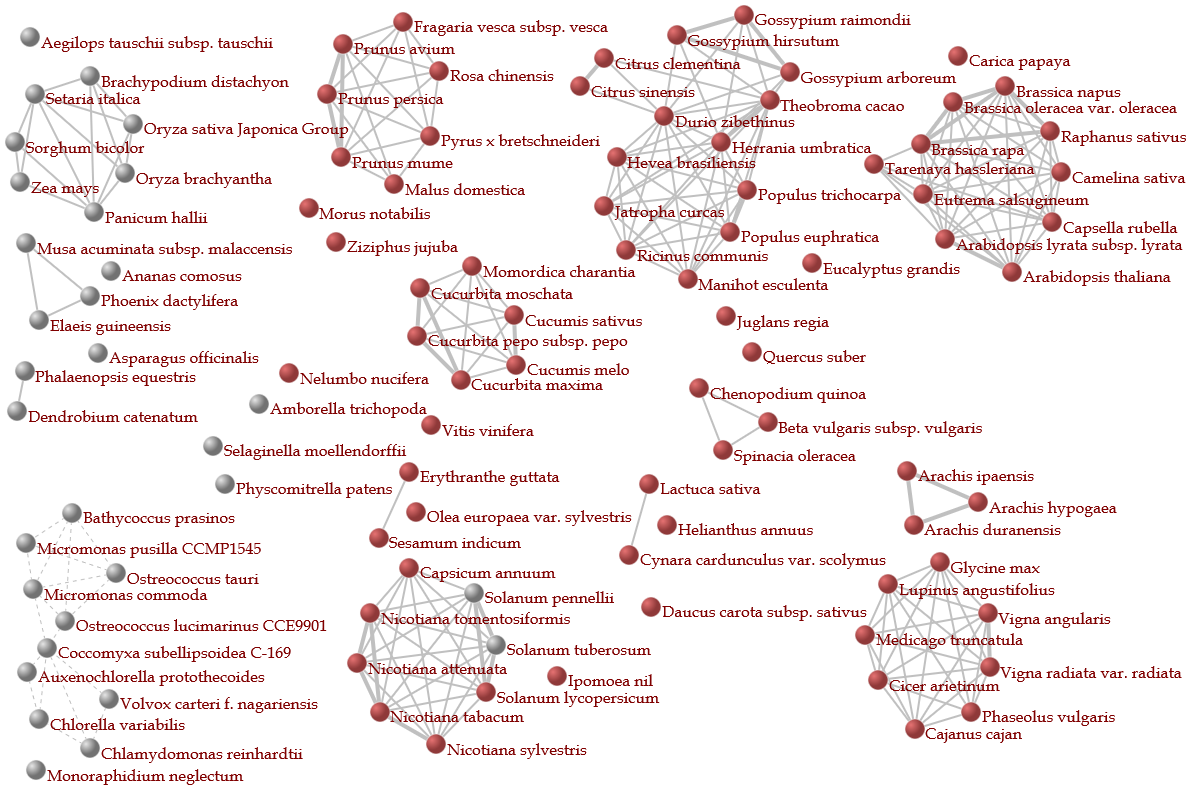
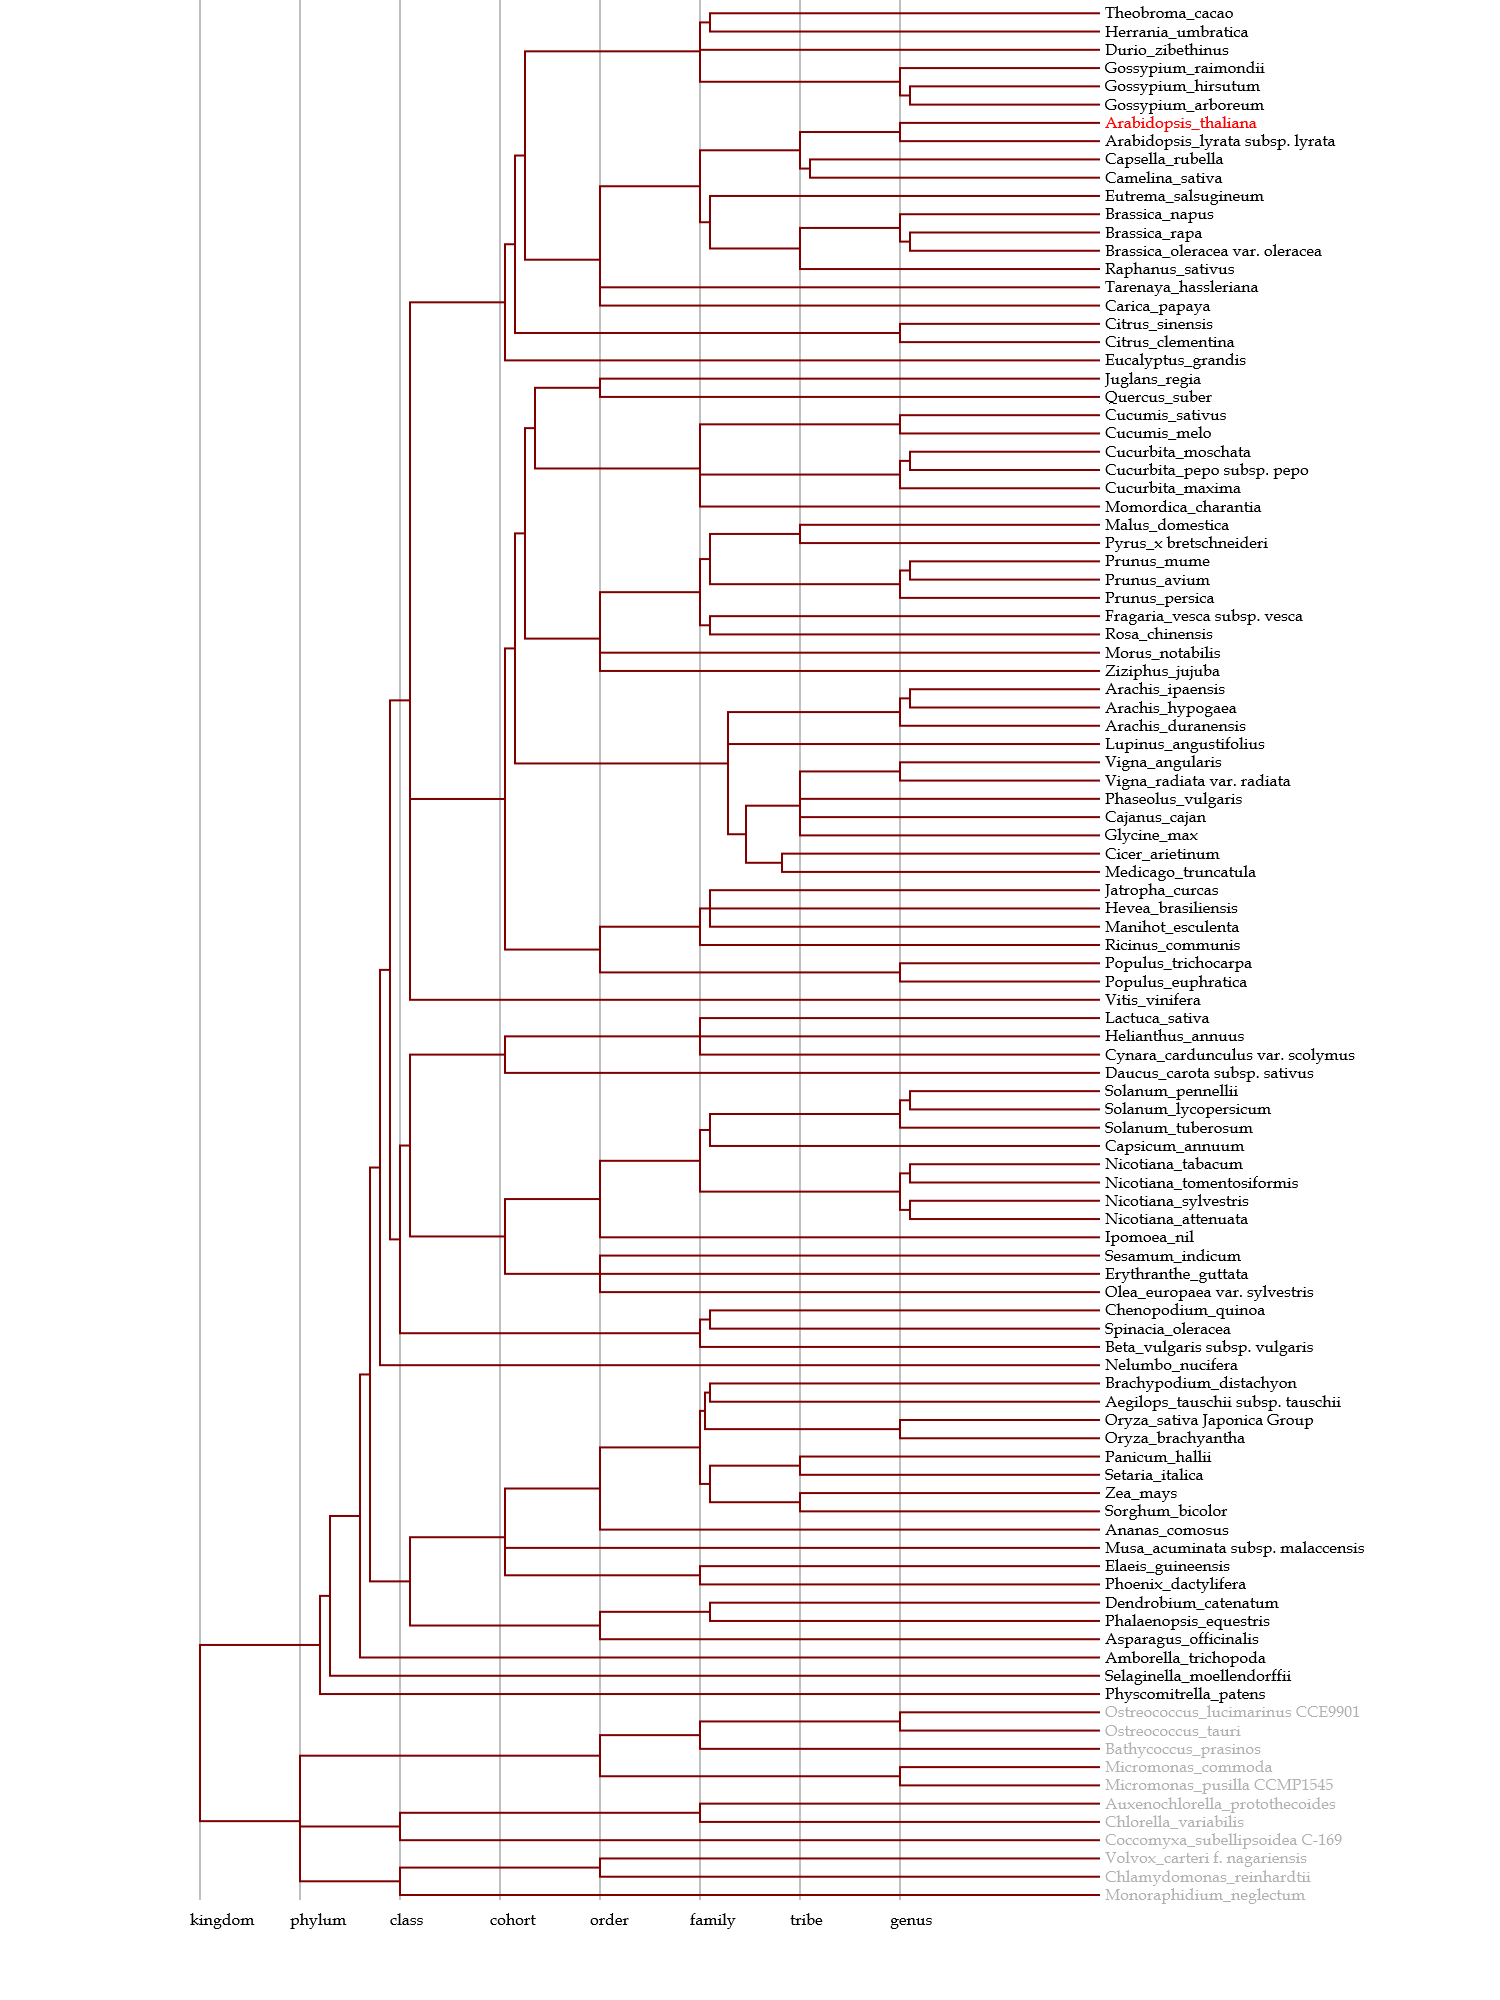
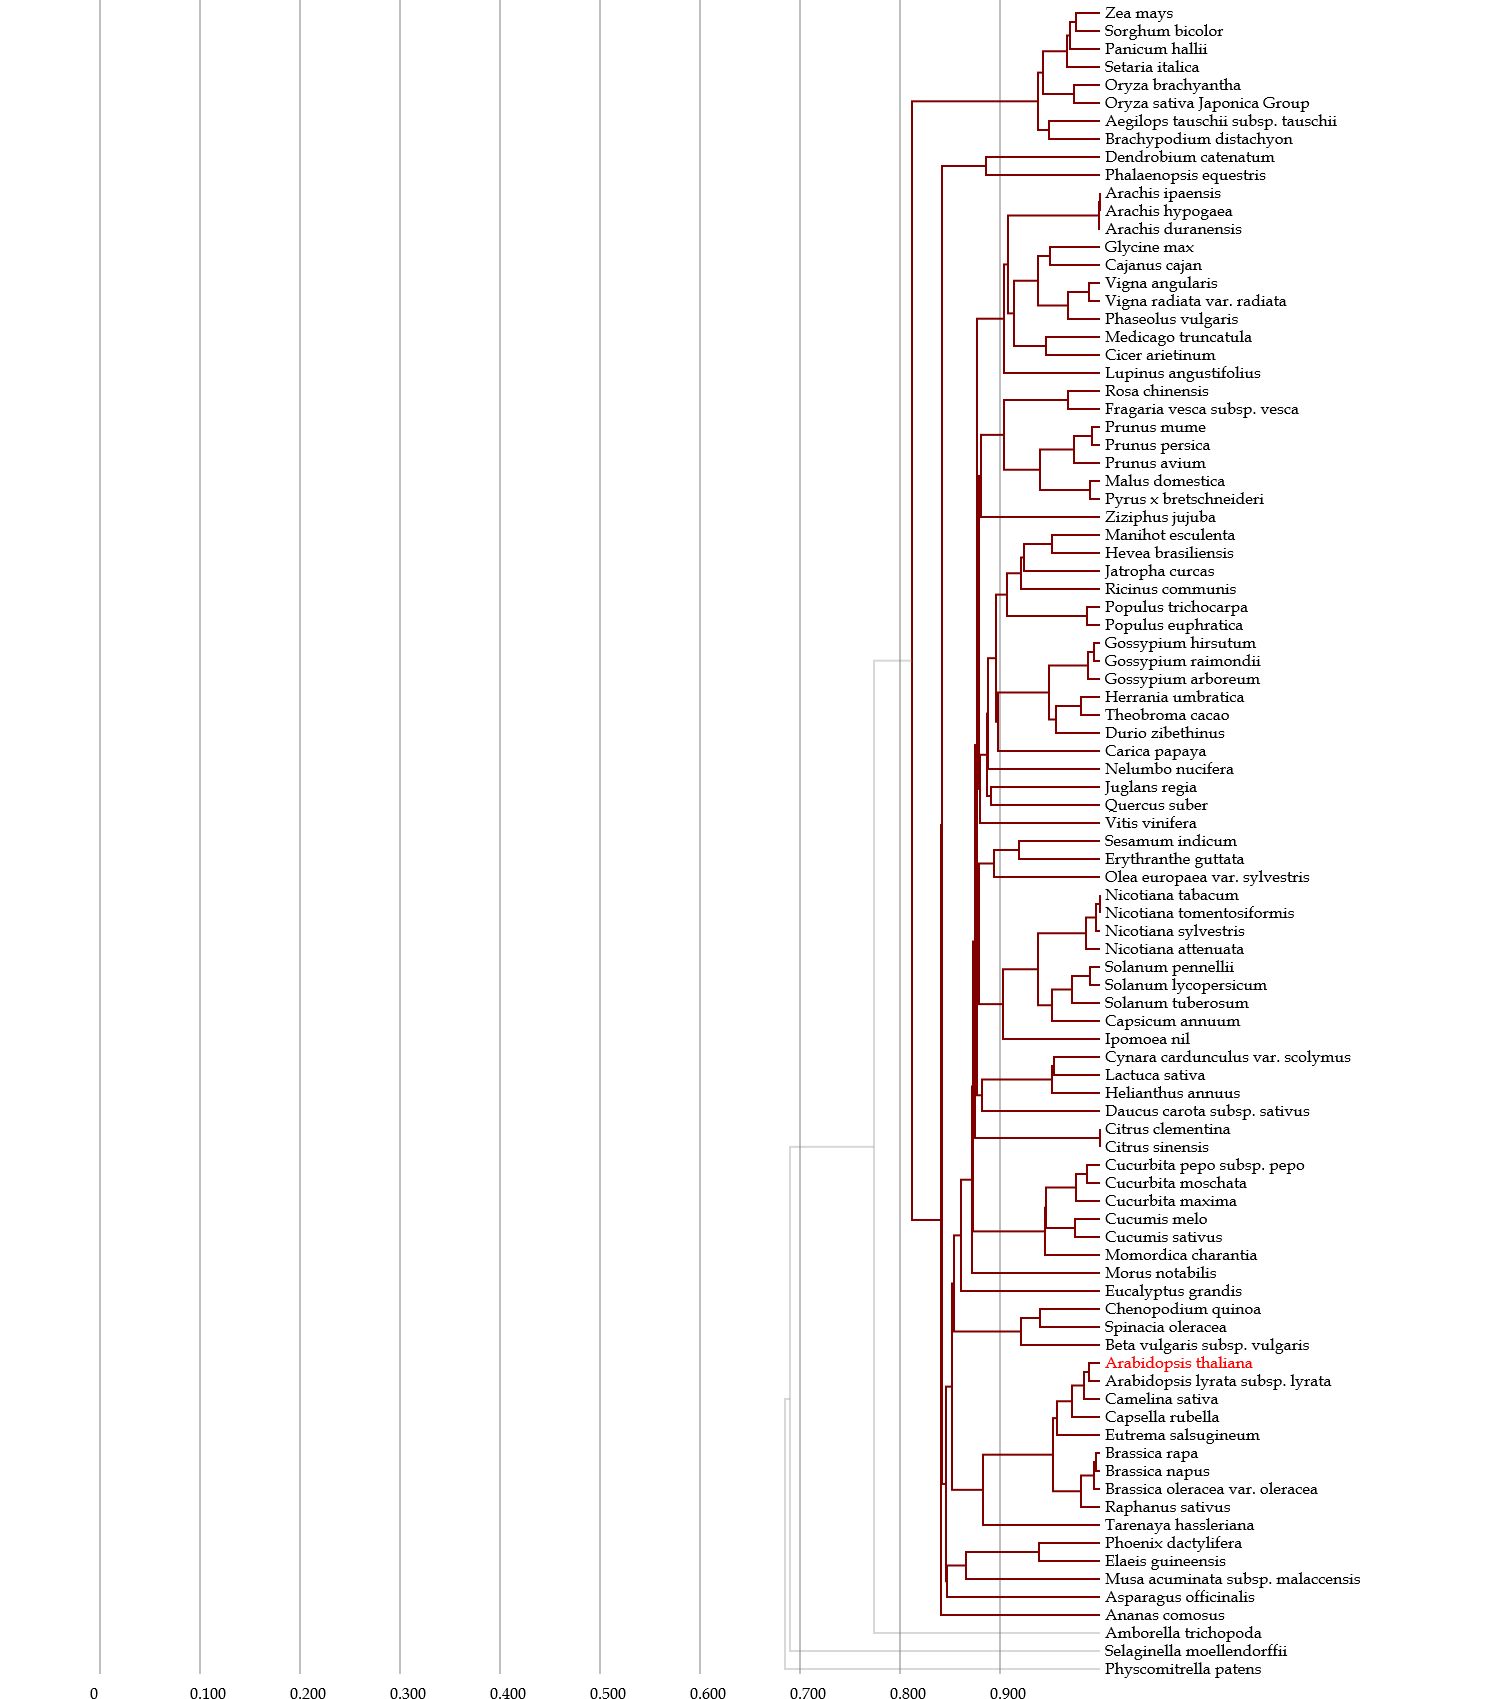
  • This network contains nodes (organisms), and these nodes are interconnected to each other.
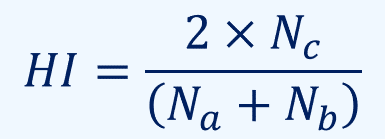
  • For the interconnection, the C.I. value was used as a threshold.
  • In the above equation, Ga, Gb, & Gc represent the numbers of genes contained in Organism A, contained in Organism B, & shared between these organisms.
  • The index ranges from zero to one.
  • When the index is one, a pair of organisms perfectly share their homologous genes, & when it is zero, the organisms share no homologous genes.
  • The topology of the organisms is based on the indices, but their positions are arbitrary.
  • In the network, a network module, in which nodes are tightly interconnected to each other, hypothetically represents an organism group that share many homologous genes with each other, and also less homologous genes with the other organisms.
  • In plants, 0.6 of the threshold was used, because several families are separated as network modules.

♦ Taxonomy tree

  • This tree is based on information mainly from the NCBI Taxonomy database, & other reports to alleviate three- or more-forked furcation in the tree.

♦ Orthology tree

  • This tree is based on genes orthologous to the gene of interest & their H.I. values.
  • In other words, it is a taxonomy tree traced from the gene of interest.
  • The Robinson-Foulds metric between this tree & taxonomy tree was calculated.
  • When the metric is zero, both trees are coincident to each other.
  • The larger distance means that these trees are more different.
  • When the metric is over the number of organisms, these trees is tentatively quite different.