♦ Data materials
- Amino acid or base sequences & information on gene/protein function are obtained from the RefSeq database.
- In the RefSeq database, these sequences are classified into six organism groups (approximately kingdom); i.e., fungi, invertebrate, plant, protozoa, vertebrate_mammalian, vertebrate_others.
- In this approach, each organism group is used for a single database.
| Organism group | # species | # genes | Release history |
|---|---|---|---|
| Plant | 104 73 |
4,385,746 2,785,715 |
September 2019 October 2017 |
| Fungi | 249 | 2,345,743 | November 2019 |
| Protozoa | 86 | 954,157 | December 2019 |
| Invertebrate | 146 | 3,273,518 | not yet |
| Vertebrate (except for Mammalian) |
127 | 4,006,839 | not yet |
| Mammalian | 110 | 4,490,015 | not yet |
| Archaea | - | - | not yet |
| Bacteria | - | - | not yet |
| Viral | - | - | not yet |
♦ Pre-data analysis
- The sequences in each organism group are counted by species to select the species that contain genes at the genome level.
- Such species are selected using a threshold of the number of genes (it depends upon each organism group); e.g., 5,000 genes for plant.
- As of November 2019, the numbers of species & genes selected for Gcorn are listed in the right table.
♦ BLASTP analysis
- In each organism group, BLASTP analyses are performed between all genes of the species selected through the pre-data analysis.
♦ Calculating homology index
- Using the result of the BLASTP analysis, homology indices (HI) between all pairs of genes are calculated.
- HI is calculated by twice the number of amino acids shared with a pair of genes over the sum of amino acids of the pair; i.e., it is equivalent to a F-measure, harmonic mean of precision & recall, of the pair.
- The index ranges between zero (dissimilar) to one (equivalent).
- For example, when the numbers of amino acids of genes A & B are 100 & 140, respectively & 90 amino acids are shared with these genes, HI is calculated as 90 x 2 / ( 100 + 140 ) = 0.75.
- HI represents a variation rate in a pair of genes.
♦ Grouping homologous genes
- Using various HIs as thresholds, genes are grouped in a manner of correlation network analysis.
- Namely, a single gene can be contained in multiple gene groups on the basis of various HIs.
- Hypothetically, a gene group represents a gene of an ancient organism.
- In the Gcorn database, therefore, the gene group is named “ancient gene.”
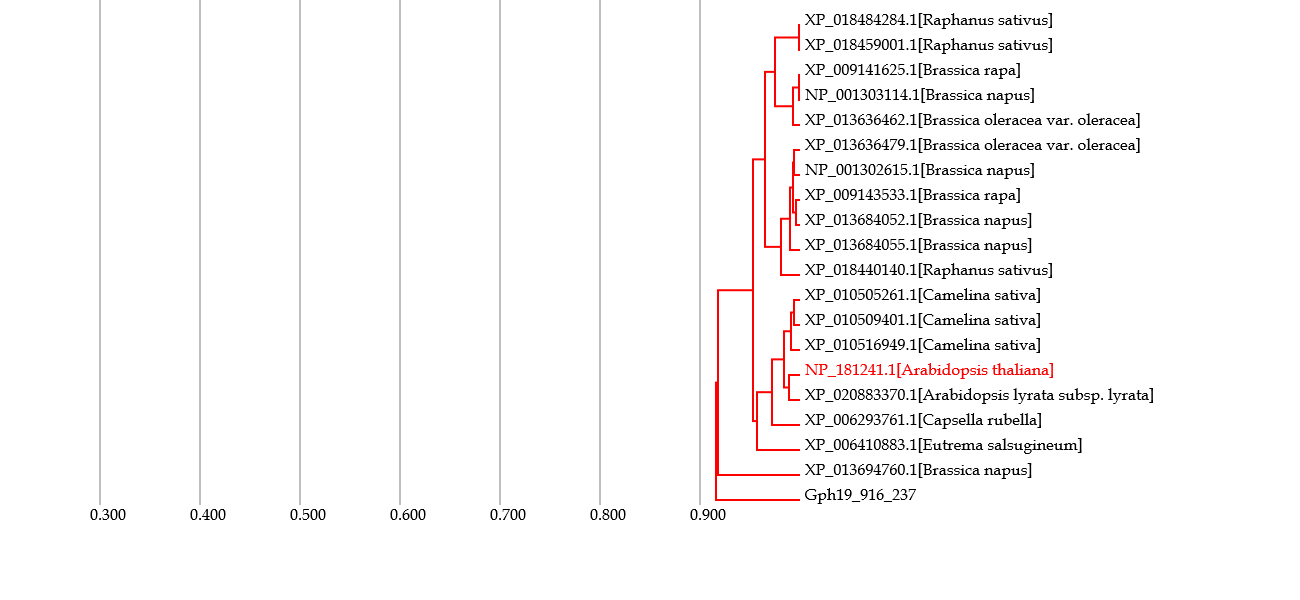
♦ Constructing phylogenetic tree for gene
- A phylogenetic tree of a gene group (ancient gene) that contains a gene of interest & around 20 genes.
- In the Gcorn database, a phylogenetic tree that contains many genes is not provided because such trees are difficult to grasp & understand it.
- Instead of such trees, Gcorn provides a line chart that represents information on ancient genes (or “gene evolution”; see the next section).
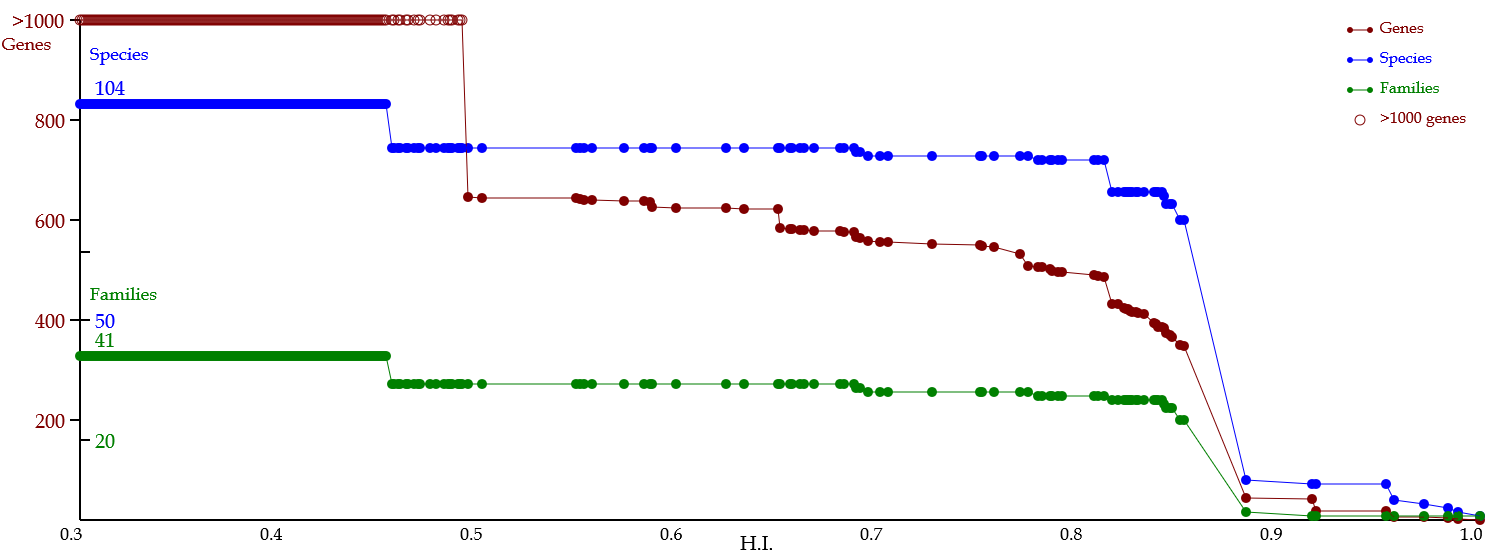
♦ Depicting line chart of gene evolution
- A line chart that represents the numbers of genes (red), species (blue), & families (green) in a lineage of ancient genes (or gene evolution).
- Namely, this line chart is a digest of a phylogenetic tree (regarding these numbers).
- Vertical & horizontal axes represent these numbers & HI, respectively.
- Horizontal axis is hypothetically along with evolution, although the speed of evolution (i.e., mutation or variation rate) is not necessarily constant.
- The line chart is composed of flat segments & slopes to represent the timings of homologous events.
- A red & flat segment represents no homologous event in this evolutionary period (of cource, a blue line is also flat).
- A red slope represents a homologous event: in the cases of a blue slope & flat segment, the period represents potentially an orthologous or paralogous event, respectively.
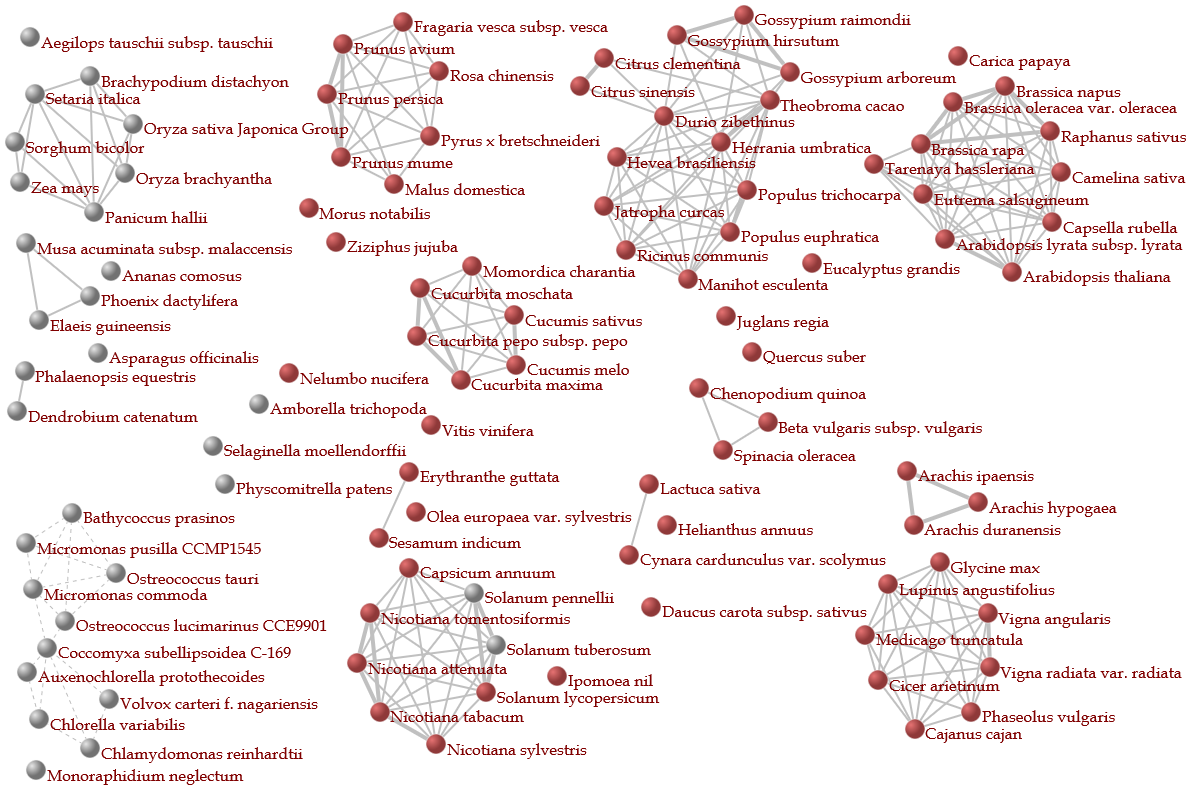
♦ Constructing correlation network between organisms
- A correlation network between orgamisms is depicted on the basis of the ratio of homologous genes.
- In the network, nodes represent orgamisms & are connected to other nodes in the cases that show the higher ratio than a threshold determined by each organism group.
- Groups (or “network modules”) in which nodes are tightly connected to each other represent organism groups that are mutually close such as members of a family.
- Red nodes represent organisms that contain genes homologous to a gene of interest on the basis of HI threshold which is changeable (0.8 as default).
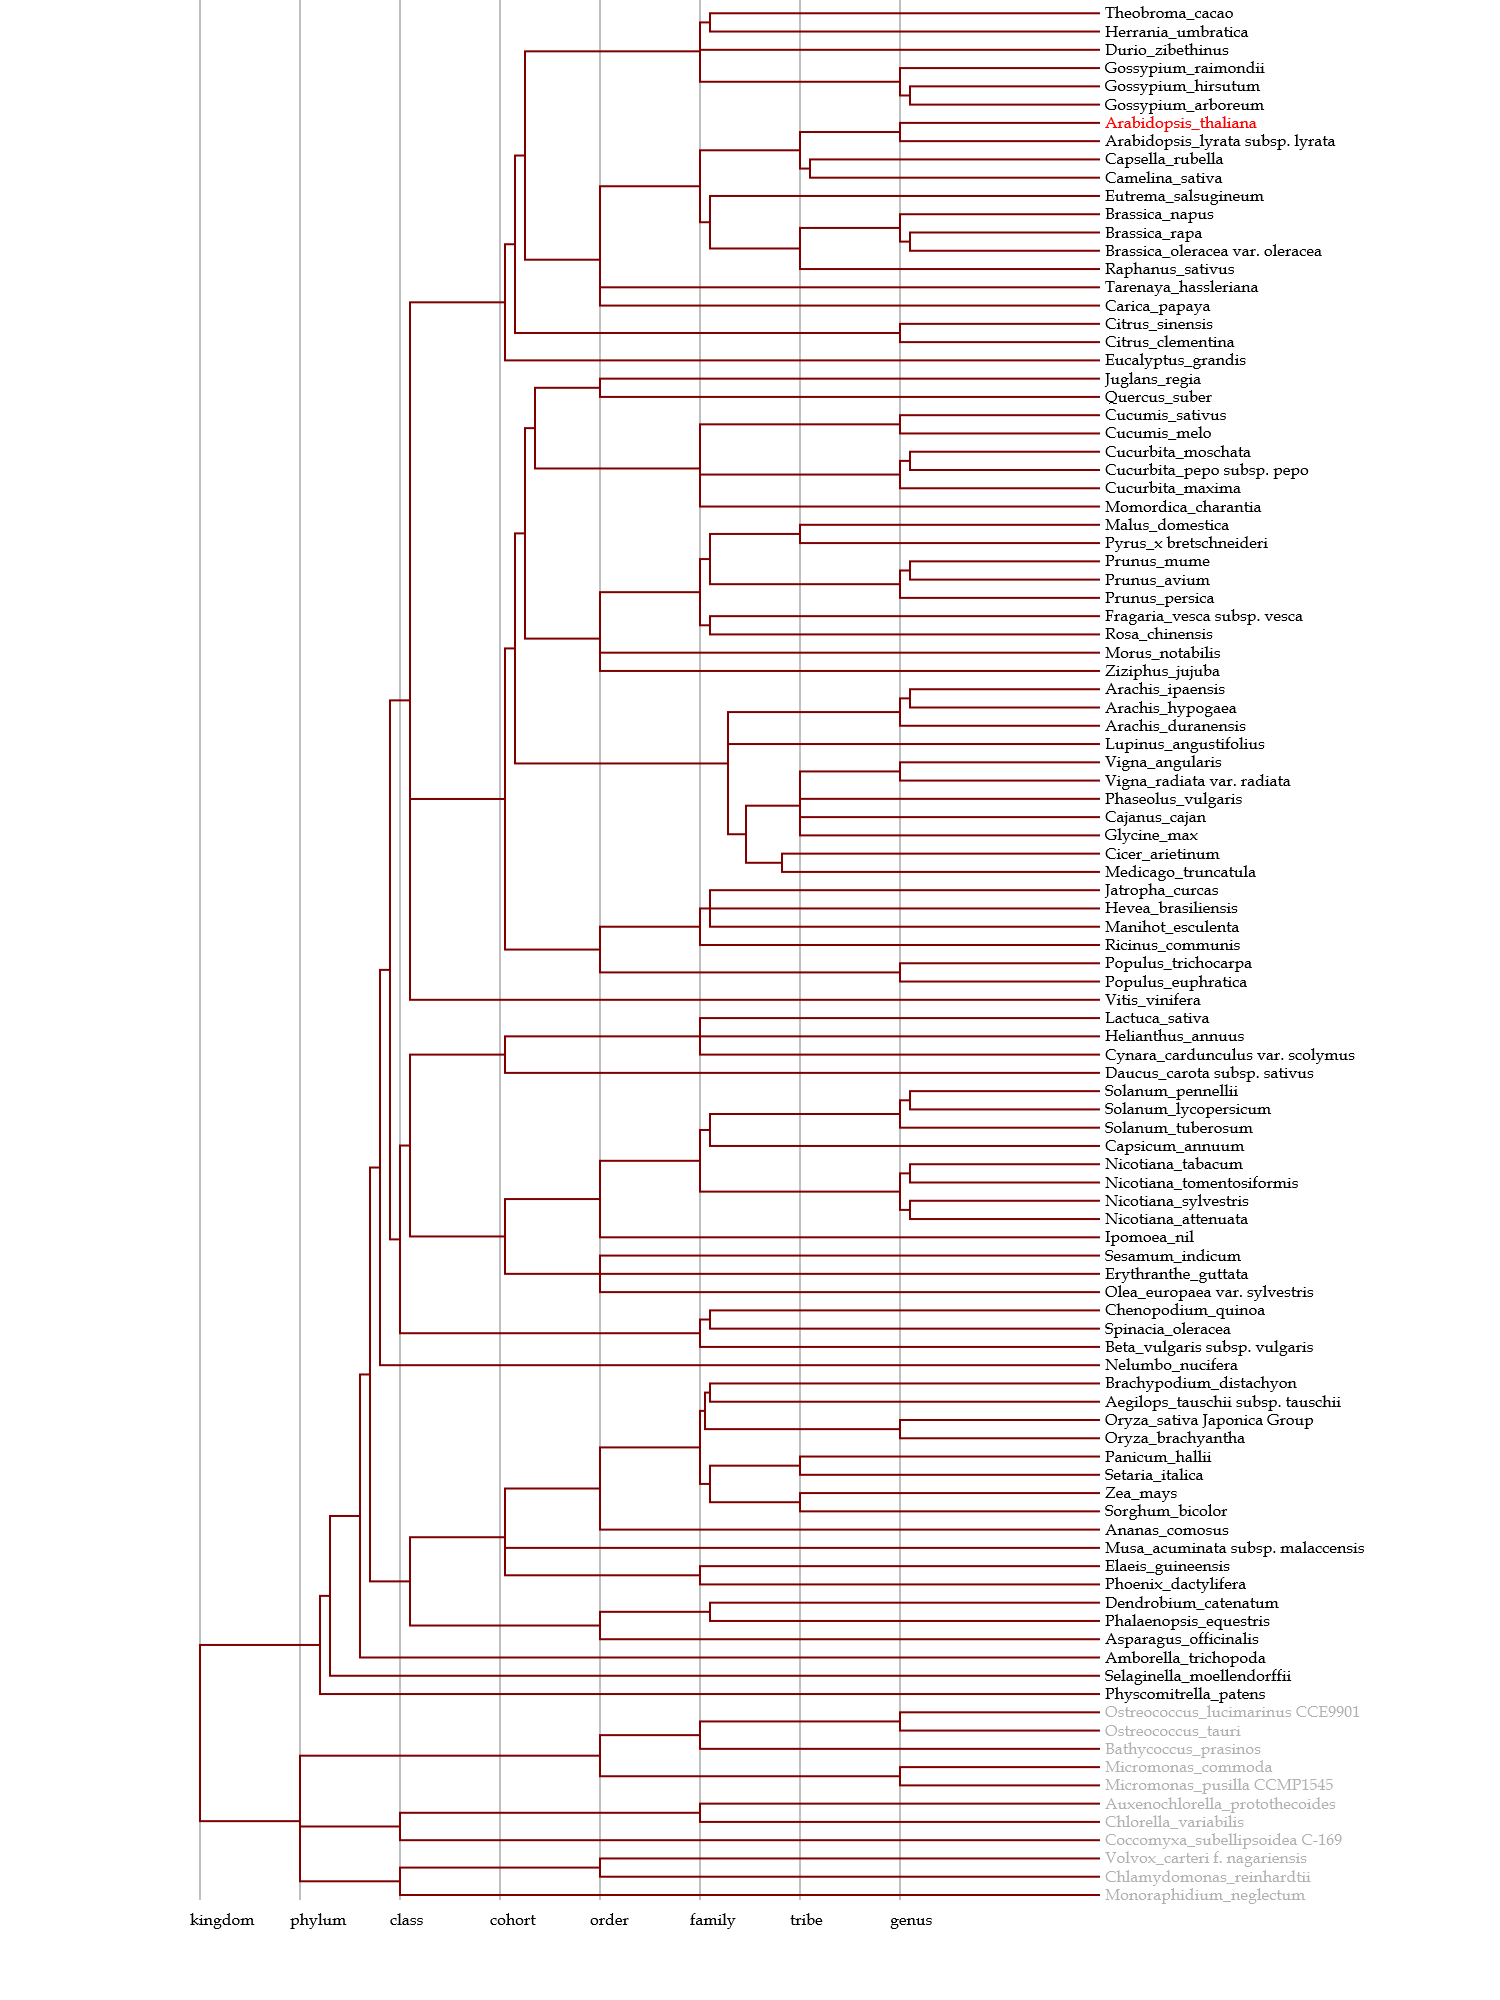
♦ Depicting taxonomy tree
- This phylogenetic tree for species is depicted on the basis of information obtained from the NCBI Taxonomy database.
- Several divergence points are based on authorized information or articles (see references for each orgaism group); e.g., the tree for plants is revised by information on APG III.
- Blue & gray nodes represent taxon with & without hyperlinks to the Taxonomy database, respectively.
- Red nodes represent organisms used in the Gcorn databases & species names in red represent those that contain genes homologous to a gene of interest based on a HI threshold.
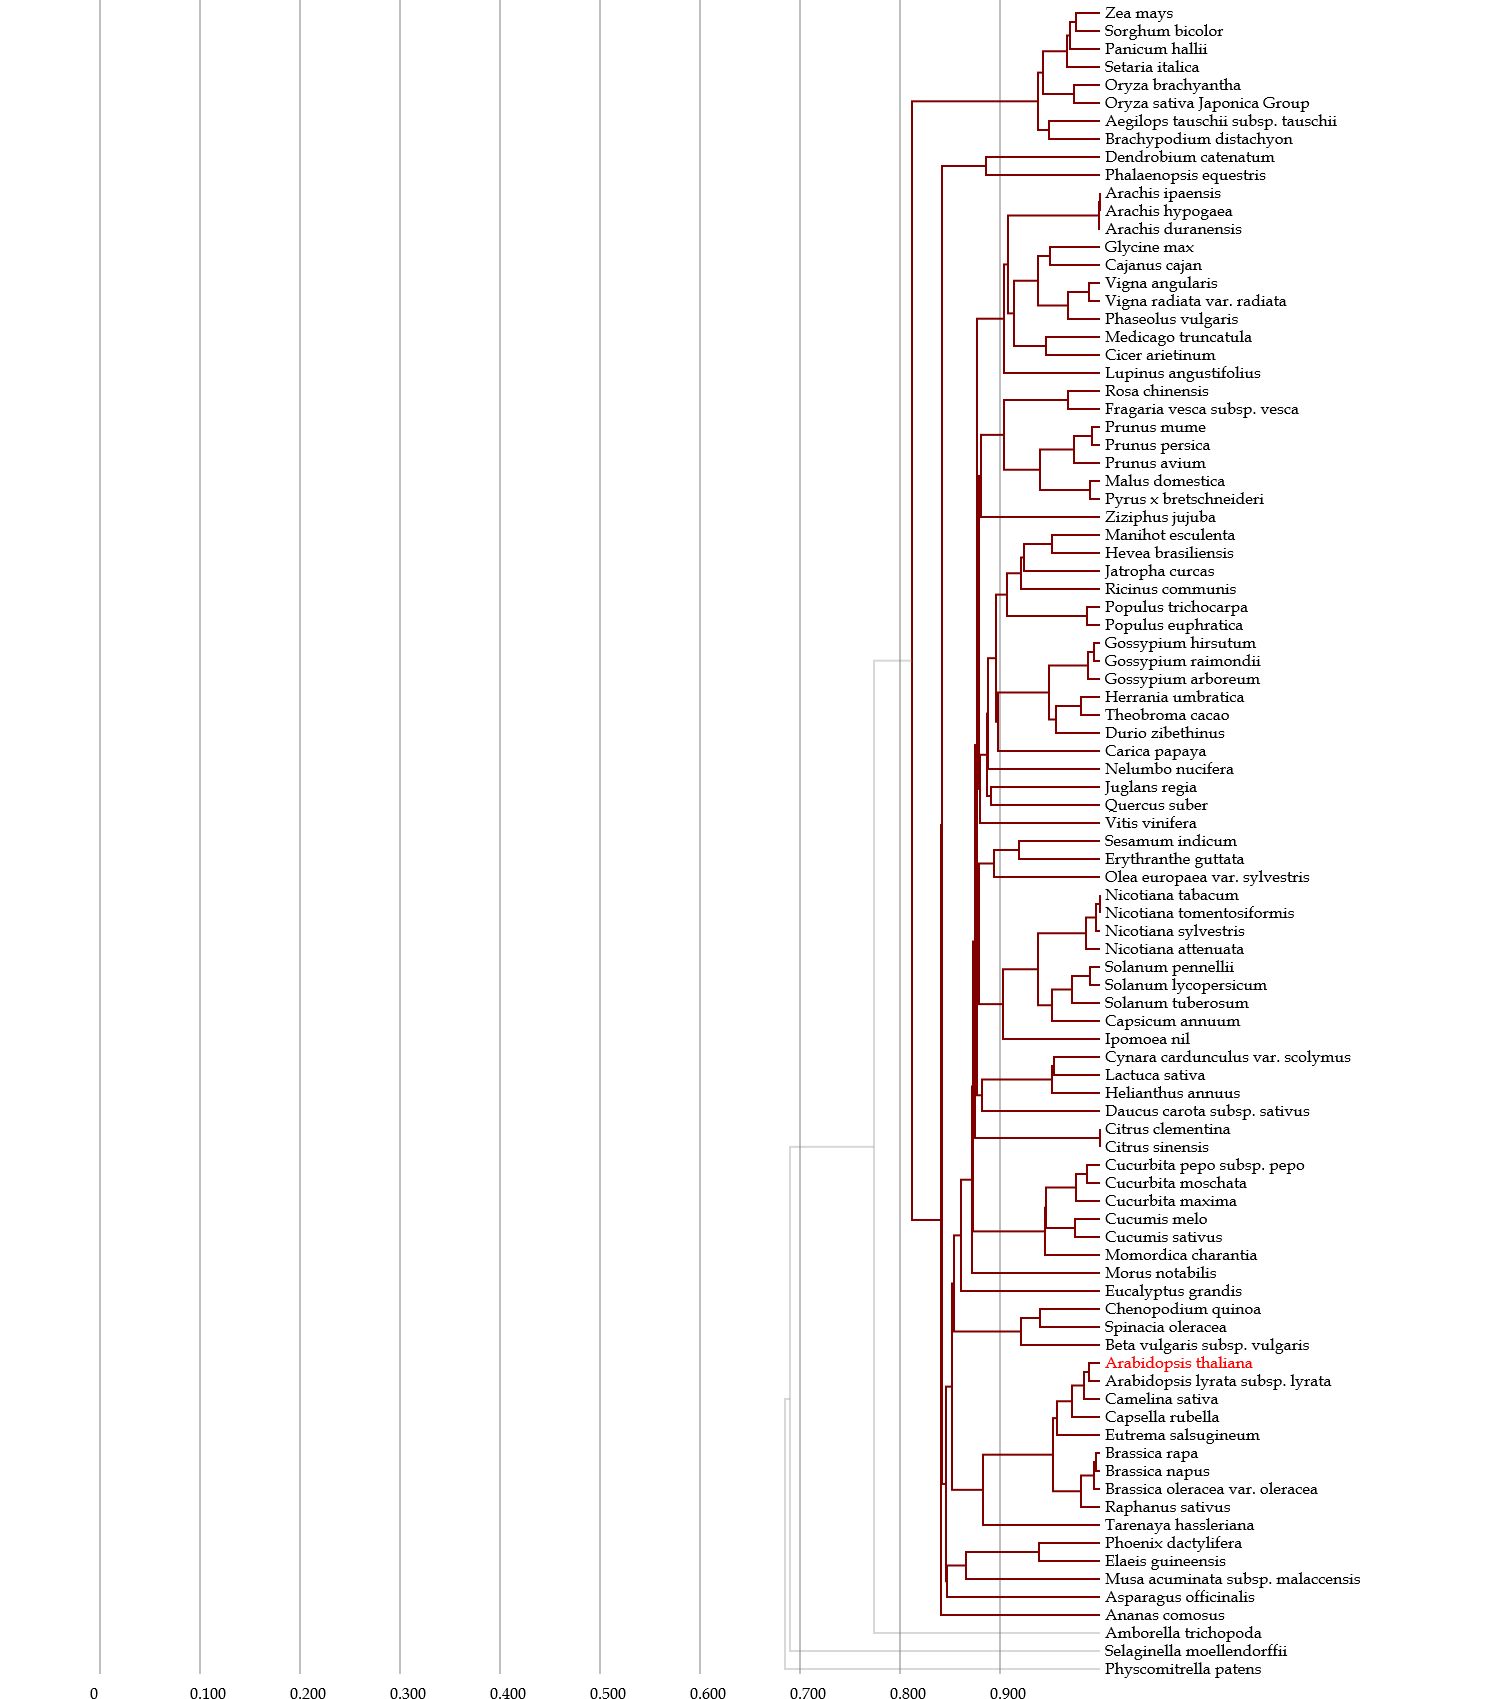
♦ Depicting orthology tree
- This tree contains genes orthologous to a gene of interest based on a HI threshold.
- When the order of branching in the tree is similar to that in the phylogenetic tree for species, the evolution (or variation) of the gene occurred similarly to speciation.
- On the other hand, when the order is dissimilar, some evolution events may occurred in a different manner to speciation.
♦ Constructing database
- The Gcorn databases are constructed using Perl/CGI & HTML scripts.
- The databases are maintained using a server of Osaka Prefecture University & each database will be updated every one or two years.